ABSTRACT
Inhibitors of the phosphatidylinositol 3-kinase/protein kinase B/mammalian target of rapamycin (PI3K/AKT/mTOR) pathway hold promise for the treatment of breast cancer, but resistance to these treatments can arise via feedback loops that increase surface expression of the receptor tyrosine kinases (RTK) epidermal growth factor receptor 1 (EGFR) and human epidermal growth factor receptor 3 (HER3), leading to persistent growth pathway signaling. We developed PET probes that provide a method of imaging this response in vivo, determining which tumors may use this escape pathway while avoiding the need for repeated biopsies. Methods: Anti-EGFR-F(ab′)2 and anti-HER3-F(ab′)2 were generated from monoclonal antibodies by enzymatic digestion, conjugated to DOTA, and labeled with 64Cu. A panel of breast cancer cell lines was treated with increasing concentrations of the AKT inhibitor GDC-0068 or the PI3K inhibitor GDC-0941. Pre- and posttreatment expression of EGFR and HER3 was compared using Western blot and correlated to probe accumulation with binding studies. Nude mice xenografts of HCC-70 or MDA-MB-468 were treated with either AKT inhibitor or PI3K inhibitor and imaged with either EGFR or HER3 PET probe. Results: Changes in HER3 and EGFR PET probe accumulation correlate to RTK expression change as assessed by Western blot (R2 of 0.85–0.98). EGFR PET probe PET/CT imaging of HCC70 tumors shows an SUV of 0.32 ± 0.03 for vehicle-, 0.50 ± 0.01 for GDC-0941–, and 0.62 ± 0.01 for GDC-0068–treated tumors, respectively (P < 0.01 for both comparisons to vehicle). HER3 PET probe PET/CT imaging of MDAMB468 tumors shows an SUV of 0.35 ± 0.02 for vehicle- and 0.73 ± 0.05 for GDC-0068–treated tumors (P < 0.01). Conclusion: Our imaging studies, using PET probes specific to EGFR and HER3, show that changes in RTK expression indicative of resistance to PI3K and AKT inhibitors can be seen within days of therapy initiation and are of sufficient magnitude as to allow reliable clinical interpretation. Noninvasive PET monitoring of these RTK feedback loops should help to rapidly assess resistance to PI3K and AKT inhibitors and guide selection of an appropriate combinatorial therapeutic regimen on an individual patient basis.
KEYWORDS
- imaging
- receptor tyrosine kinase
- breast cancer
- PI3K
- AKT
The phosphatidylinositol 3-kinase/protein kinase B/mammalian target of rapamycin (PI3K/AKT/mTOR) pathway is a mediator of cell growth and proliferation that frequently is hyperactivated in cancers, including breast cancer (1–3). Given its central role in cancer growth, multiple inhibitors of this pathway have been developed or are under investigation. However, it has been demonstrated that inhibition of the PI3K/AKT/mTOR pathway stimulates feedback loops that result in increased receptor tyrosine kinases (RTK) expression and activation (4–7). This increased RTK activity leads to persistent growth pathway signaling that limits the sensitivity of cancers to PI3K/AKT/mTOR inhibitors in preclinical studies (5,6), and evidence suggests that these resistance mechanisms are likewise active in clinical populations (8,9). The pattern of increased expression and activation of RTKs appears to depend primarily on which signaling node is inhibited (Fig. 1) (5,6,10,11), however, changes in expression are regulated by multiple cellular factors, with the pattern of RTK expression varying across tumor cell lines and patient tumors (8,9). On the basis of the hypothesis that increased RTK expression and activation mediate resistance to PI3K/AKT/mTOR inhibition, new combination therapeutic regimens are being tested in preclinical studies and in clinical trials (12–14). However, methods have yet to be developed to identify patient subpopulations that will be resistant to PI3K/AKT/mTOR inhibition due to activation of this escape pathway.
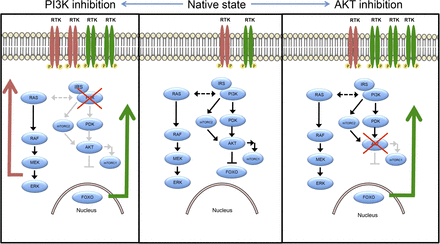
FIGURE 1.
PI3K/AKT/mTOR signaling is regulated by intrinsic feedback. With AKT inhibition, intrinsic feedback inhibition mechanisms built into AKT signaling pathway are released, resulting in increased RTK surface expression and activation, primarily of HER3. With PI3K inhibition, same AKT feedback inhibition mechanisms are released; however, because of cross-talk between PI3K and MAPK pathway, release of feedback inhibition mechanisms along MAPK pathway also contribute to increased RTK expression and activation. These feedback patterns are influenced by multiple cellular factors and are thought to differ meaningfully across patient tumors, such that degree of change in expression cannot be known a priori.
Drug-dependent changes in surface RTK expression are predictive of persistent growth pathway signaling (5,6,9) and occur within hours to days of treatment initiation. Thus, monitoring changes in surface RTK expression would be valuable as a rapid biomarker for drug response prediction and for choosing appropriate therapeutic regimens. However, the only current way to clinically monitor these changes involves invasive biopsy both before and after initiating treatment. This approach remains impractical because of the high associated patient-risk, the cost and time involved for repeated biopsy, and challenges of spatial sampling that may not accurately reflect tumor heterogeneity (15).
To avoid these problems, we have developed RTK-specific PET imaging agents to allow for rapid, noninvasive assessment of drug-dependent changes in RTK expression. Our new protocol circumvents the risks of biopsy and allows for dynamic clinical trial design and treatment monitoring. Specifically, we have engineered antibody fragment–based PET probes specific for human epidermal growth factor receptor 3 (HER3) and epidermal growth factor receptor 1 (EGFR), the 2 main receptors that tumor cells may upregulate in response to PI3K/AKT/mTOR inhibition and whose overexpression can oppose the antiproliferative effects of these inhibitors (5,9,10).
In this work, we demonstrate that the changes in RTK expression induced by PI3K/AKT/mTOR pathway inhibition are readily imaged in in vivo models, with changes in SUV that would readily be distinguishable in a clinical setting. We thus can distinguish cell types with an active escape pathway from those more likely to be sensitive to drug inhibition. Our findings demonstrate a novel method for rapidly predicting targeted therapeutic resistance without the need for repeated biopsies. This may help in the rapid clinical assessment of therapeutic response and thus may become an important tool for decision making in cancer treatment.
MATERIALS AND METHODS
Preparation of F(ab′)2 Fragments
F(ab′)2 fragments were prepared from either cetuximab (Bristol-Myers Squibb) or HER3 mAb105 (Clone H3.105.5; Thermo Scientific) using a FragIT MicroSpin column (Genovis) and purified by an immobilized NAb Protein A spin column (ThermoScientific). F(ab′)2 fragment purity was assessed with sodium dodecyl sulfate polyacrylamide gel electrophoresis. Trace metals were removed from all buffers using Chelex-100 cation-exchange resin (Sigma-Aldrich). F(ab′)2 was conjugated with the bifunctional 2-(4-isothiocyanatobenzyl)-1,4,7,10-tetraazacyclodo-decane-1,4,7,10-tetraacetic acid (p-SCN-Bn-DOTA; Macrocyclics, Inc.) chelate in anhydrous dimethyl sulfoxide by modification of established methods (16). DOTA-mAb-F(ab′)2 was purified from excess DOTA by centrifugation using an Amicon Ultracel 30K (EMD Millipore). Purified DOTA-mAb-F(ab′)2 concentration was determined spectrophotometrically (extinction coefficient at 280 nm = 1.45 [mg/mL] − 1 cm-1). DOTA substitution level of F(ab′)2 fragments (chelators/molecule) was determined as previously described (17).
Radiolabeling Procedures
Radiolabeling was performed with 67Ga (MDS-Nordion) for in vitro studies or 64Cu (University of Wisconsin) for in vivo use, as described previously (18). Radiolabeled compounds were purified by centrifugation on an Amicon Ultracel 30K (EMD Millipore). Labeled compound purity was determined on a γ-counter (Wizard 2480; Perkin Elmer) after size-exclusion chromatography using a PD-10 Desalting Column (GE Healthcare Bio-Sciences AB).
Cell Culture
MDA-MB-468, MDA-MB-231, BT-474, HCC-70, and MCF-7 human breast carcinoma cell lines were obtained from the American Type Culture Collection. All cell lines were tested for Mycoplasma contamination using PCR (LookOut Mycoplasma PCR Detection Kit; Sigma). Cell lines were cultured in Leibovitz L-15 medium, RPMI-1640 medium, or Eagle minimum essential medium as appropriate and supplemented by 20% (v/v) fetal bovine serum, penicillin (100 U/mL), and streptomycin (100 μg/mL). Cells were maintained in a humidified atmosphere of 5% CO2 at 37°C. Subculturing was performed using a 0.25% trypsin-0.1% ethylenediaminetetraacetic acid solution.
Competitive Binding Studies
The binding affinity of radiolabeled DOTA-cetuximab-F(ab′)2 (EGFR PET probe) or DOTA-HER3 mAb105-F(ab′)2 (HER3 PET probe) was determined by direct radioligand binding assays, with slight modification of previously described methods (supplemental data; available at http://jnm.snmjournals.org) (19).
Cell Studies
For cell studies with EGFR PET probe, MDA-MB-468, MDA-MB-231, HCC-70, and BT-474 cell lines were seeded in 24-well plates (1 × 10⁵ cells/well) and grown to 80% confluence. Cells were treated with vehicle; 1-, 2-, or 5-μM solutions of GDC-0068 (AKT inhibitor), GDC-0941 (pan-PI3K inhibitor), or BYL-719 (PI3K α-inhibitor) dissolved in 500 μL of medium for 48 h. AKT inhibitor was kindly provided by Genentech. GDC-0941 and BYL719 were obtained from the SU2C/PI3K Dream Team mouse pharmacy. Ten microliters of EGFR PET probe were then added to each well and incubated for 60 min at 4°C. Medium was then aspirated, and wells were washed with ice-cold phosphate-buffered saline 3 times to remove unbound EGFR PET probe. Five hundred microliters of 0.25% trypsin were added to each well for 10 min to detach cells. Cells were aspirated and counted on an automated hematocytometer (Countess; Invitrogen). Cellular accumulation of tracer in each well was determined by collecting cell suspensions with radioactivity measured by γ-counter (Wizard 2480; Perkin Elmer). All cell studies were repeated in triplicate. Additional cell study methods are described in the supplemental materials.
For cell studies with the HER3 PET probe, the protocol followed was as above, using MDA-MB-468, HCC-70, and MCF-7 cell lines and HER3 PET probe to detect changes in HER3 surface expression. All cell studies were repeated in triplicate.
Western Blot Analysis
Western blots were performed in tandem with cell-binding studies, with cell treatment groups as above, using previously described methodology (16). Primary antibodies were EGFR receptor XP rabbit mAb (Cell Signaling; 1:1,000 dilution), HER3/ErbB3 XP rabbit mAb (D22C5 [Cell Signaling Technology, Inc.]; 1:1,000 dilution), and β-actin rabbit mAb antibody (Cell Signaling; 1:100 dilution). For semiquantitative analysis, bands were quantified and normalized to β-actin bands with Carestream spectral imaging software (Carestream). All cell studies were repeated in triplicate. Additional methods for surface Westerns are described in the supplemental materials.
In Vivo Imaging Studies
EGFR Imaging Studies
All animal experiments complied with ethical regulations and were approved by our Institutional Animal Care Committee. Mice were maintained with free access to standard chow and water. All mice were randomized by ear-tag identification. Nude (nu/nu) female mice were subcutaneously injected with 1 × 10⁶ HCC-70 cells into the right shoulder (n = 12 total). Once tumors measured 5 mm in diameter, mice received 48 h of treatment with 75 mg/kg of GDC-0068, GDC-0941, or vehicle (n = 4 for each group) administered by oral gavage every 12 h in 0.2 mL of vehicle (0.5% methylcellulose and 0.2% polysorbate 80). Eight additional nude (nu/nu) female mice were subcutaneously injected with 1 × 10⁶ MDA-MB 231 into their right shoulder, randomized as above. Once tumors measured 5 mm in diameter, mice received 48 h of treatment with 75 mg/kg GDC-0941 or vehicle (n = 4 for each group).
Forty-eight hours after starting treatment, mice were injected with approximately 7,400,000 Bq (200 μCi) of EGFR PET probe via the tail vein. Twenty-four hours after injection, mice underwent static PET/CT imaging using a SuperArgus PET/CT (Sedecal). After CT acquisition, PET images were obtained for 15 min in 2 bed positions. Images were reconstructed using 3-dimensional ordered-subset expectation maximization (4 iterations, 16 subsets) and were corrected for scatter and randoms. The SUVmean for each tumor was calculated in a 3-dimensional region of interest autodrawn around the tumor using a 30% isocontour threshold. Values are expressed as SUVmean ± SEM. Images were postprocessed using VivoQuant (InviCRO).
EGFR Versus HER3 Imaging Studies
Nude female mice were subcutaneously injected with 1 × 10⁶ MDA-MB-468 cells into their right shoulder (n = 16 total). Once tumors measured 5 mm in diameter, mice received treatment with vehicle only or 75 mg/kg of GDC-0068 administered by oral gavage every 12 h in 0.2 mL of vehicle (n = 8 for each group). Forty-eight hours after starting treatment, each treatment group was randomized to injection with either approximately 7,400,000 Bq (200 μCi) of EGFR PET probe or HER3 PET probe via the tail vein. Twenty-four hours after injection, mice underwent static PET/CT imaging with protocol, quantification, and postprocessing as above.
Statistical Analysis
Statistical analysis was performed using GraphPad Prism (version 4; GraphPad Software). The 2-way unpaired t test was used to compare SUVmean of all HCC-70 and MD-MBA-231 xenografts imaged with EGFR PET probe and to compare SUVmean of MDA-MB-468 tumors imaged with EGFR or HER3 probe. A P value of less than 0.05 was considered statistically significant. All error bars represent SEM. For correlation of radiotracer binding to EGFR/β-actin and HER3/β-actin ratios, linear regression was performed to find linear line of best-fit, and coefficient of determination (R2) was calculated.
For animal studies, sample size was established through power calculation that determined necessary sample size for the study to detect a 20% difference between treatment and nontreatment group SUVmean.
RESULTS
RTK PET Probe Development
We developed F(ab′)2-based imaging agents specific for the external domains of EGFR and HER3, obtaining probes with improved in vivo properties in comparison to whole monoclonal antibodies (20,21). Our probes bind their target proteins with a dissociation constant of 8.6 nM for EGFR and 6.8 nM for HER3 expressed on the cellular surface (Supplemental Fig. 1).
Change in RTK Surface-Expression Induced by PI3K or AKT Inhibition Measured by RTK PET Probes
EGFR PET Probe Detects Dynamic Changes in EGFR Surface Expression with Targeted Therapy
A panel of breast cancer cell lines was treated for 48 h either with vehicle or with the PI3K inhibitor GDC-0941. Binding experiments with EGFR tracer demonstrated that each cell line had a different response to PI3K inhibition (Fig. 2, left), with EGFR PET probe detecting surface expression changes of 25%, 139%, 88%, and 16%, respectively, when the MDAMB-468, MDA-MB-231, BT-474, and HCC-70 cell lines were treated with 5 μM of GDC-0941. An increase in EGFR surface expression determined by these cell-binding experiments appears to correlate closely with an increase in total EGFR expression, as calculated by Western blot analysis from the same cell lines treated under identical conditions (Fig. 3, left), with note made that determination of the correlation strength is limited by number of therapeutic concentration data points. Surface Western experiments performed on a subset of cell lines demonstrated that most RTK expression is found in the membrane fraction (Supplemental Fig. 2). Experiments performed with the PI3Kα inhibitor BYL-719 demonstrated a different profile of EGFR expression changes, presumably reflecting the different target affinity profiles of these 2 drugs (Supplemental Fig. 3).
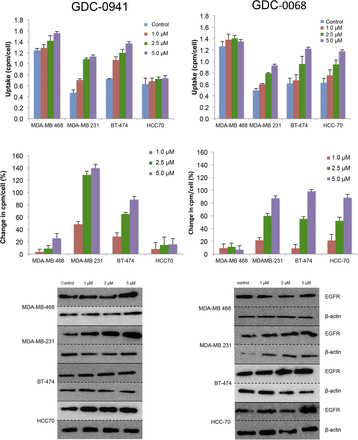
FIGURE 2.
EGFR PET probe measures effects on cellular EGFR surface expression after treatment with either PI3K inhibitor or AKT inhibitor. After 48 h of treatment with vehicle or PI3K inhibitor GDC-0941 (left) or AKT inhibitor GDC-0068 (right) at specified doses, cell lines were incubated with EGFR PET probe for 1 h, and binding was measured by γ-counting. Middle row reflects percentage change in EGFR expression relative to control. Westerns blots of EGFR and β-actin were obtained from cells under same treatment conditions.
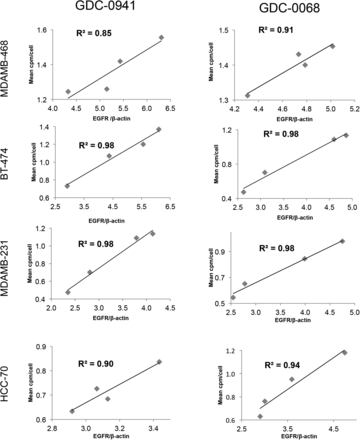
FIGURE 3.
Changes in EGFR PET probe binding correlate closely with protein expression changes. Comparison of binding of radiolabeled EGFR PET probe with EGFR/β-actin intensity measured by Western blot analysis after treatment of specified cell lines with increasing concentrations of GDC-0941 (left) or GDC-0068 (right). Linear regression was used to determine goodness-of-fit and coefficient of determination.
The same panel of breast cancer cell lines was also treated for 48 h with the AKT inhibitor GDC-0068. Changes in EGFR surface expression induced by AKT inhibition differ from those induced by PI3K inhibition, with increases of 6%, 87%, 98%, and 88%, respectively, for the cell lines MDA-MB-468, MDA-MB-231, BT-474, and HCC-70 (Fig. 2, right). These minimal EGFR expression changes observed in MDA-MB-468 cells may be secondary to baseline EGFR amplification in this cell line. An increase in EGFR surface expression determined by cell-binding experiments correlated closely with an increase in total EGFR expression calculated by Western blot analysis of EGFR expression changes (Fig. 3, right). Additionally, analysis of the binding kinetics of the EGFR PET probe demonstrates that accumulation of the EGFR PET probe is not significantly altered between 4°C and 37°C at 4 h or between live and paraformaldehyde fixed cells, suggesting that cellular uptake does not factor strongly into uptake (Supplemental Fig. 4).
HER3 PET Probe Detects Changes in HER3 Surface Expression in Response to Targeted Therapy
Changes in HER3 surface expression were assessed with the HER3 PET probe after 48 h of treatment with the PI3K inhibitor GDC-0941. At 5 μM, HER3 probe detected HER3 surface expression increases of 97%, 80%, and 76%, respectively, in MDA-MB-468, HCC-70, and MCF-7 cells (Fig. 4, left). An increase in HER3 surface expression determined by cell-binding experiments appears to correlate closely with an increase in total HER3 expression, as determined by Western blot analysis from the same cell lines treated under identical conditions (Fig. 5, left). Binding experiments performed after treatment with the PI3Kα inhibitor BYL-719 also demonstrated increases in HER3 expression (Supplemental Fig. 5).
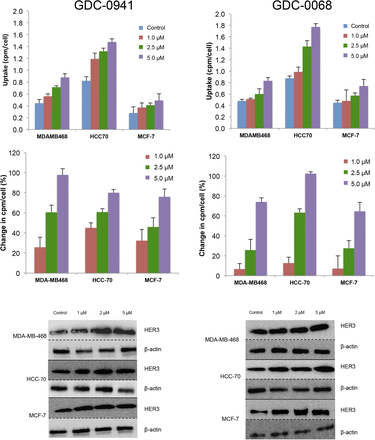
FIGURE 4.
HER3 PET probe measures effect on cellular HER3 surface expression after treatment with either PI3K inhibitor or AKT inhibitor. After 48 h of treatment with vehicle or PI3K inhibitor GDC-0941 (left) or AKT inhibitor GDC-0068 (right) at specified doses, cell lines were incubated with HER3 PET probe for 1 h, and binding was measured by γ-counting. Middle row reflects percentage change in HER3 expression relative to control. Westerns blots of HER3 and β-actin obtained from cells under same treatment conditions.

FIGURE 5.
Changes in HER3 PET probe binding correlate closely with protein expression changes. Comparison of binding of radiolabeled HER3 PET probe HER3/β-actin intensity measured by Western blot analysis after treatment of specified cell lines with increasing concentrations of GDC-0941 (left) or GDC-0068 (right). Linear regression was used to determine goodness-of-fit and coefficient of determination.
Changes in HER3 surface expression were also assessed with the HER3 PET probe after 48 h of treatment with control or with the AKT inhibitor GDC-0068. Cellular binding studies with the HER3 PET probe demonstrated dose-dependent increases in HER3 expression for all cell lines, with increases of 74%, 102%, and 65%, respectively, in MDA-MB-468, HCC-70, and MCF-7 cells, at 5 μM of GDC-0068 (Fig. 4, right). An increase in HER3 surface expression determined by cell-binding experiments correlated closely with increases in total HER3 expression, as determined by Western blot analysis from the same cell lines treated under identical conditions (Fig. 5, right).
Quantitative PET/CT Imaging with RTK Probes In Vivo
EGFR PET Probe Visualizes Changes in EGFR Expression with PI3K/AKT Inhibition
Nude mice with HCC-70 xenografts were treated with vehicle, GDC-0941, or GDC-0068 (n = 4 for each group) for 48 h before injection with approximately 7,400,000 Bq (200 μCi) of EGFR PET probe. Mice were imaged with PET/CT 24 h after injection of the imaging probe. SUVmean of vehicle-treated tumors was 0.32 (±0.03), of GDC-0941–treated tumors it was 0.50 (±0.01), and of GDC-0068–treated tumors it was 0.62 (±0.01), representing an increase in SUVmean of 57% and 95%, respectively (P < 0.01 for both comparisons to vehicle). SUVmean of GDC-0068–treated tumors increased by 24% versus GDC-0941–treated tumors (P = 0.01) (Fig. 6). Similar results were obtained in MDA-MB-231 tumors (Supplemental Fig. 6).
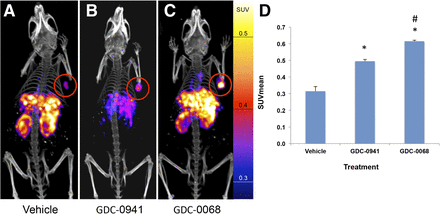
FIGURE 6.
EGFR PET probe visualizes changes in EGFR expression with treatment of HCC70 tumors. HCC70 xenografts imaged with EGFR PET probe after treatment with vehicle (A), GDC-0941 (B), or GDC-0068 (C). Images normalized to 0.6 SUV. SUVmean of HCC70 xenografts imaged with EGFR PET probe after treatment (D) demonstrates change in SUV of 57% and 95% in comparison to vehicle, respectively, n = 4 for all groups, *P < 0.05. Change in SUVmeanof GDC-0068– vs. GDC-0941–treated xenografts of 24%, #P < 0.05.
HER3 and EGFR PET Probe Imaging Demonstrates Differential Change of EGFR and HER3 Expression in Response to AKT Inhibition In Vivo
Nude mice implanted with MDA-MB-468 xenografts were treated with vehicle or GDC-0068 for 48 h before injection with either approximately 7,400,000 Bq (200 μCi) of HER3 PET probe or EGFR PET probe (n = 4 for each group). Mice were imaged with PET/CT 24 h after imaging probe injection. Consistent with in vitro cell-binding studies, the EGFR PET probe SUVmean of tumors did not significantly change in comparison to control (SUVmean of 0.48 ± 0.03 vs. 0.53 ± 0.02, P = 0.11). HER3 PET probe SUVmeanof tumors increased from 0.35 ± 0.02 for vehicle-treated tumors to 0.73 ± 0.05 for GDC-0068–treated tumors, an increase of 108% (P < 0.01) (Fig. 7).
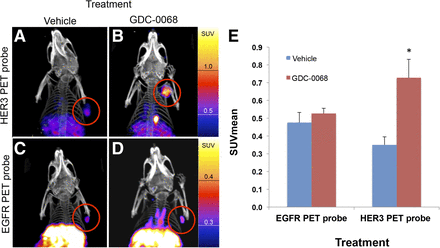
FIGURE 7.
Imaging with HER3 PET probe versus EGFR PET probe demonstrates differential RTK expression in response to treatment with AKT inhibitor. MDAMB468 xenografts imaged with HER3 PET probe after treatment with vehicle (A) or GDC-0068 (B) demonstrate 108% increase in SUVmean (E),*P < 0.05. MDAMB468 xenografts imaged with the EGFR PET probe after treatment with vehicle (C) or GDC-0068 (D) demonstrate no significant change in SUVmean, n = 4 for all groups.
DISCUSSION
Increased expression and activation of several receptor tyrosine kinases (EGFR, HER3, insulin-like growth factor 1 receptor, among others) begins shortly after PI3K/AKT/mTOR pathway inhibition and allows for persistent signaling along downstream growth pathways, thus mediating resistance to PI3K/AKT/mTOR inhibitors (5,6,22). Because individual tumors differentially upregulate RTK expression (8,9), measuring RTK expression levels in tumors both before treatment and shortly after initiation of PI3K/AKT/mTOR inhibition may provide useful information to help guide therapy by demonstrating the RTK upregulation pattern of a given tumor. This information could then be used to select appropriate combination therapies to overcome therapeutic resistance. Currently, measurement of change in RTK expression levels would require sequential needle-guided or surgical biopsies. This procedure has high health-related risks for patients, is expensive, and does not take into account the intrinsic intra- and intertumor heterogeneity. Thus, a noninvasive method that enables real-time measurement of tumoral RTK expression changes on treatment would significantly improve clinical practice and open the possibility for more rapid, effective decision making. Immuno-PET imaging, using imaging agents specific for the RTKs of interest, allows for the noninvasive assessment of tumoral RTK expression and thus may be a useful tool in precision cancer therapy.
Using receptor-specific PET probes for EGFR and HER3, we demonstrate that changes in surface expression of these RTKs, as induced by PI3K and AKT inhibitors, can be noninvasively assessed. Total RTK signal correlates closely with target protein expression, as verified by quantitative Western blot measurement, and multiple cell-binding assays confirm that changes in uptake are directly due to changes in RTK expression. Furthermore, we demonstrate unique changes dependent on tumor line and on the inhibited pathway node, underscoring the need for individual tumor monitoring.
We further our in vitro work by showing that these changes in RTK expression induced by PI3K/AKT inhibition can also be readily imaged in vivo. Specifically, we show with EGFR PET probe imaging of HCC-70 xenografts that SUVmean increased by 57% after treatment with PI3K inhibition and 95% after treatment with AKT inhibition in comparison to untreated controls (Fig. 6). We note that interpretation of the changes in SUV would be strengthened by comparison with tumoral protein expression. Our results are consistent with a recent study by Tao et al. that demonstrated increased sensitivity of HCC-70 cells to GDC-0068 relative to GDC-0941 and that the addition of the EGFR/HER3 inhibitor MEHD7945A to therapy resulted in decreased cell proliferation (9). The results of our study in combination with their therapeutic outcome suggest the value of RTK imaging in guiding combination therapy for breast cancer.
In another example, we demonstrate that in vivo treatment with AKT inhibitors results in increased HER3 expression, with an SUVmean of HER3 PET probe increasing by 108% in treated MDAMB468 xenografts in comparison to untreated control (Fig. 7). These data are consistent with a recent report showing that treatment with the AKT inhibitor GDC-0068 resulted in increased HER3 levels in patient samples (8). By comparing the imaged changes in EGFR expression versus HER3 expression, we demonstrate that different RTKs do not increase uniformly in response to PI3K/AKT/mTOR pathway inhibition. Hence, treatment of MDAMB468 xenografts with GDC-0068 results in a greater than 100% increase in HER3 PET probe SUVmean but results in a nonsignificant 11% change in EGFR PET probe SUVmean. In summary, we show that the magnitude of changes in SUVmean of EGFR PET probes and HER3 PET probes induced by treatment with the PI3K inhibitor GDC-0941 or the AKT inhibitor GDC-0068 differ both according to cell line and according to treatment type when tested in a panel of breast cancer cell xenografts. Furthermore, we note that the magnitude of imaged changes in the xenograft models (as measured by SUVmean) would be readily interpretable in clinical practice (23,24). The potential therapeutic relevance of our results is highlighted by the findings of Tao et al. (9), in which they demonstrate both the upregulation of EGFR and HER3 with PI3K/AKT pathway inhibition and the therapeutic benefit of adding EGFR/HER3 inhibitors to PI3K/AKT inhibitors. Our study is limited by the use of cell lines and nude mice that do not model the stromal reactions of human breast cancer as well as the challenges of translating mouse studies to human trials.
We thus propose that clinical imaging of dynamic changes in RTK expression levels before and shortly after initiating therapy may be of benefit in rapidly identifying patients resistant to PI3K/AKT/mTOR inhibition. Furthermore, the information from imaging could be used to optimize combination treatment regimen choices both to maximize efficacy and to avoid the extra toxicity of combination therapy regimens when they are not necessary.
To date, the role of imaging in guiding cancer therapy has largely been retrospective in nature, reporting on changes in tumor volumes, sites of disease, and metabolic activity after months of treatment. We suggest a new paradigm of cancer imaging in which dynamic imaging of RTK expression changes prospectively helps to guide and target treatment, allowing rapid adjustment of targeted therapeutic regimens as tumors respond to pathway node inhibition. This paradigm may allow for optimization of targeted drug regimens while reducing patient time spent on ineffective therapeutic regimens, with their corresponding side effects.
CONCLUSION
In this study, we developed EGFR and HER3 PET probes and used them to assess changes in RTK expression in breast cancer models in response to targeted inhibition that are predictive of therapeutic resistance. Our results show that imaged changes in EGFR and HER3 expression in response to targeted inhibition correlate closely to established methods of protein expression measurement and are of sufficient magnitude as to be readily clinically interpretable. This imaging methodology may be used as a biomarker for rapid noninvasive assessment of resistance to targeted anticancer therapies. Rapid assessment of response and resistance in a noninvasive fashion may in turn allow for dynamic cancer treatment strategies that allow for increasing treatment personalization.
DISCLOSURE
The costs of publication of this article were defrayed in part by the payment of page charges. Therefore, and solely to indicate this fact, this article is hereby marked “advertisement” in accordance with 18 USC section 1734. This research was supported by NIH U01CA084301, P50CA127003, and U01CA143056; by a “Stand Up to Cancer” Dream Team Translational Research Grant, a Program of the Entertainment Industry Foundation (SU2C-AACR-DT0209) and the Breast Cancer Research Foundation; and by the Dubai Harvard Foundation for Medical Research (DHFMR, grant number 223439). Dr. Jose Baselga has consulting and advisory positions at Genentech. No other potential conflict of interest relevant to this article was reported.
FOOTNOTES
Contributed equally to this work.
Published online Apr. 14, 2016.
© 2016 by the Society of Nuclear Medicine and Molecular Imaging, Inc.

