Quantitative CD3 PET Imaging Predicts Tumor Growth Response to Anti-CTLA-4 Therapy
Benjamin M. Larimer, Eric Wehrenberg-Klee, Alexander Caraballo and Umar Mahmood
2016 October
ABSTRACT
Immune checkpoint inhibitors have made rapid advances, resulting in multiple Food and Drug Administration–approved therapeutics that have markedly improved survival. However, these benefits are limited to a minority subpopulation that achieves a response. Predicting which patients are most likely to benefit would be valuable for individual therapy optimization. T-cell markers such as CD3—by examining active recruitment of the T cells responsible for cancer-cell death—represent a more direct approach to monitoring tumor immune response than pretreatment biopsy or genetic screening. This approach could be especially effective as numerous different therapeutic strategies emerge, decreasing the need for drug-specific biomarkers and instead focusing on T-cell infiltration, which has been previously correlated with treatment response. Methods: A CD3 PET imaging agent targeting T cells was synthesized to test the role of such imaging as a predictive marker. The 89Zr-p-isothiocyanatobenzyl-deferoxamine-CD3 PET probe was assessed in a murine tumor xenograft model of anti–cytotoxic T-lymphocyte antigen-4 (CTLA-4) immunotherapy of colon cancer. Results: Imaging on day 14 revealed 2 distinct groups of mice stratified by PET signal intensity. Although there was no significant difference in tumor volume on the day of imaging, in the high-uptake group subsequent measurements revealed significantly smaller tumors than in either the low-uptake group or the untreated controls. In contrast, there was no significant difference in the size of tumors between the low-uptake and untreated control mice. Conclusion: These findings indicate that high CD3 PET uptake in the anti-CTLA-4–treated mice correlated with subsequent reduced tumor volume and was a predictive biomarker of response.
KEYWORDS
- CD3
- PET
- cancer immunotherapy
- response prediction
Rapid advances in the field of tumor immunology have led to multiple new therapies aimed at increasing the tumoral immune response against highly malignant cancers, with current approvals existing for treatment of melanoma, lung, and renal tumors, and multiple additional research programs ongoing (1–3). Response rates to these therapies are significantly higher than to standard chemotherapy (19%–50% vs. 4%–15%), and patients who respond typically have more durable responses than with standard treatment (2,4,5). However, most patients receiving immunotherapy will not respond yet remain at risk of severe side effects, which occur in up to 55% of patients (5). There is no standard yet for identifying or predicting tumor response. Furthermore, evaluation of response to immunotherapies using standard imaging techniques remains challenging because of immune infiltrates that can masquerade as tumor growth (6). The desire to more rapidly identify patients likely to respond has spurred effort to elucidate both predictive biomarkers and methods to better monitor therapeutic efficacy.
Significant evidence has accumulated to suggest that an increased presence of tumor-infiltrating lymphocytes, including CD4 and CD8 lymphocytes, is predictive of improved prognosis and a response to immunomodulatory therapy (7–10). CD3 is a part of the T-cell-receptor complex that serves as a global T-lymphocyte marker and has also been correlated with response. By serving as a marker of total T-cell infiltration, CD3 may represent a more abundant target than subpopulation markers, bringing about an increased PET signal and thus being a more robust predictor.
Although tumors are often characterized through invasive biopsy, the highly heterogeneous and dynamic nature of the tumoral immune response limits the utility of this technology, and there is currently no established method to monitor CD3+ infiltration. In contrast, PET imaging of CD3 may help monitor and guide therapy by providing a real-time accurate and quantitative assessment of lymphocyte infiltration across the entire tumor burden, including metastases, as well as in normal organs, without the need for repeated invasive procedures. In this study we therefore sought to develop a CD3 PET probe to assess the ability of PET imaging to predict immune response to therapy with the cytotoxic T-lymphocyte antigen-4 (CTLA-4) checkpoint inhibitor, which is actively being investigated in numerous clinical trials (e.g., NCT01975831, NCT02261220, NCT02060188, and NCT02205333).
MATERIALS AND METHODS
All chemicals and liquid solvents were obtained from Sigma-Aldrich unless otherwise stated. CT26 murine colon carcinoma cells and CD3-expressing murine T-cell lymphoma TK-1 cells were purchased from American Type Culture Collection and cultured in RPMI-1640 medium supplemented with 10% fetal bovine serum and 1% penicillin and streptomycin.
Conjugation and Radiolabeling
The monoclonal antimouse CD3 antibody clone 17A2 was purchased from R&D Systems. The antibody was reconstituted in sterile phosphate-buffered saline, purified by size-exclusion chromatography to ensure absence of impurities, and dialyzed into 0.1 M sodium bicarbonate, pH 9. After purification, the antibody was conjugated to a bifunctional metal chelator according to established protocols (11). Briefly, the antibody was diluted to 2 mg/mL in sodium bicarbonate buffer, mixed with 5 μL of (3 mg/mL) DFO (Macrocyclics), and incubated at 37°C for 30 min. The reaction was purified and buffer exchanged into 0.5 M 4-(2-hydroxyethyl)-1-piperazineethanesulfonic acid at a concentration of 1 mg/mL.
For radiolabeling, 74 MBq of 89Zr-oxalic acid (PerkinElmer) were adjusted to pH 7.2 with 1 M sodium bicarbonate, pH 9, and added to 0.5 mg of the DFO-CD3 antibody. The reaction was incubated for 1 h at room temperature, and unreacted 89Zr was removed by size-exclusion chromatography. The radiochemical purity was determined by instant thin-layer chromatography, and yield was determined using a γ-counter.
Binding Assays
To assess the affinity and specificity of the 89Zr-DFO-CD3 antibody, an in vitro competitive binding assay was performed. The radiolabeled, purified antibody was diluted to 1 × 10⁶ cpm/mL in RPMI-1640 with 1% (w:v) bovine serum albumin, and 10 μL were added to 105 CD3-expressing TK-1 murine lymphoma cells. As an antibody control, 89Zr-DFO-mouse IgG was also subjected to competitive binding assay. Increasing amounts of unmodified antibody were added to appropriate aliquots and incubated at 37°C for 1 h. After incubation, the cells were pelleted by centrifugation, washed 3 times with phosphate-buffered saline, and counted by γ-counter to measure the retained cpm, which directly correlates with total antibody binding.
Additionally, the cell specificity of each antibody was analyzed using either target TK-1 cells or CT26 murine colon cancer cells. Purified 89Zr-DFO-CD3 or 89Zr-DFO-IgG was added to 105 TK-1 or CT26 cells at a concentration of 0.37 MBq and incubated at 37°C for 1 h. In the same manner as for the competitive binding assay, the cells were pelleted and washed, and the retained cpm was measured.
Tumor Inoculation
All animal studies were conducted using 8- to 12-wk-old female BALB/c mice (Charles River Laboratories). The mice were housed and maintained by the Center for Comparative Medicine at Massachusetts General Hospital following animal protocols approved by the Institutional Animal Care and Use Committee. Tumors were inoculated by subcutaneous injection of 5 × 10⁵ CT26 cells diluted 1:1 in Matrigel (Corning) into the left rear flank.
Anti-CTLA-4 Treatment
For immunomodulatory therapy studies, the mice were treated with an intraperitoneal injection of either 200 ng of murine anti-CTLA-4 (n = 7) (BioXCell) or, as a control, normal saline (n = 4). The mice were treated 4, 7, and 10 d after implantation of xenografts (10). Tumor size was monitored by calipers on days 7, 10, 12, 14, and 17 after inoculation.
Tumor Analysis
Ex vivo tumor analysis studies were performed on a separate preliminary group of mice prior to PET imaging in order to analyze the presence of CD3 infiltrate on the proposed day of imaging. Treated mice were sacrificed on day 14 after tumor inoculation. The tumors were excised and divided equally for immunohistochemical analysis and analysis of initial whole-tumor protein expression by Western blotting. For Western blotting, the tumors were lysed in 1% sodium dodecyl sulfate and subjected to sodium dodecyl sulfate–polyacrylamide gel electrophoresis. Blots were transferred to nitrocellulose, blocked with 5% nonfat dry milk, and probed with the appropriate antibodies. The antibodies were diluted in 1% nonfat dry milk with 0.1% (v:v) polysorbate-20 as follows: CD3 (Abcam 16669), 1:200; CD8 (Abcam 108292), 1:1,000; FoxP3, a marker of regulatory T cells (Cell Signaling Technologies 4275S), 1:1,000; and β-actin (Cell Signaling Technologies 4970S), 1:1,000. All primary antibody binding was detected by goat antirabbit horseradish peroxidase conjugated antibody (Abcam ab6721) diluted at 1:1,000 in the same buffer as the primary antibodies. Bands were detected by the addition of SignalFire enhanced chemiluminescence reagent (Cell Signaling Technologies) and visualized on a Kodak in vivo FX Pro system (Carestream Health), and semiquantitative analysis was performed using Carestream spectral imaging software. Immunohistochemical staining was performed on formalin-fixed, paraffin-embedded 10-μm slices of tumor to confirm the cellular location of CD3 expression. Antigen was retrieved using the microwave procedure with ethylenediaminetetraacetic acid buffer, pH 8. Anti-CD3 antibody (Abcam ab5690) was diluted at 1:200 and detected using a rabbit-specific horseradish peroxidase/3,3′-diaminobenzidine detection immunohistochemistry kit (Abcam).
PET Imaging
A 37 MBq/mL dose of 89Zr-DFO-CD3 in normal saline was prepared for injection. The CT26 tumor–bearing mice were injected on day 11, and the radiolabeled antibody was allowed to clear for 3 d. On day 14, the mice were imaged on a rodent Triumph PET/CT scanner (GE Healthcare). After the CT acquisition, PET images were obtained for 15 min at 2 bed positions. The images were constructed using 3-dimensional maximum-likelihood expectation maximization (4 iterations, 16 subsets) and corrected for scatter and randoms. The SUVmean for each tumor was calculated in a 3-dimensional region of interest automatically drawn around the tumor using a 30% isocontour threshold. A region of interest surrounding the liver was also drawn to correct for injection efficiency, and the tumor-to-liver ratio was calculated (tumor-to-liver SUVmean = tumor SUVmean/liver SUVmean). The images were postprocessed using VivoQuant (inviCRO).
Statistical Analysis
Statistics were analyzed using Prism software (version 4; GraphPad). Nonlinear regression was used to fit the data to a competitive binding assay, and 2-way Student ttesting was used to compare binding of 89Zr-DFO-CD3 to TK-1 and CT26 cells and binding of radiolabeled CD3 and IgG antibodies to TK-1 cells. Mean tumor volumes on day 17 were analyzed by 1-way ANOVA, and tumor-to-liver SUVmean ratios were analyzed by unpaired t testing. All quantifications represent the mean ± SEM.
RESULTS
Conjugation and Radiolabeling
Conjugation and radiolabeling of the CD3 antibody resulted in a pure, highly specific probe for CD3-expressing cells. Conjugation of anti-CD3 antibody with DFO resulted in 0.8 ± 0.2 chelates per antibody (Fig. 1A). The average yield of radiolabeling was 68% ± 6%, with a specific activity of 50 ± 7 MBq/mg and radiochemical purity greater than 95%.

FIGURE 1.
Characterization of 89Zr-DFO-CD3 antibody on PET imaging. (A) Synthesis and postpurification characteristics of antibody. (B) Competitive binding assay using CD3+ mouse lymphoma cells and either radiolabeled CD3 antibody or control antibody. (C) Cellular specificity of CD3 probe and control antibody as ascertained by cell binding assay with CD3+ TK-1 cells and CD3− CT26 murine colon carcinoma cells. ***P < 0.001.
Binding Assays
The competitive binding assays for the CD3 and control radiolabeled antibodies demonstrated that the 89Zr-CD3 PET probe bound with high affinity (2.6 ± 1.2 nM) and specificity to the CD3-expressing mouse lymphoma cell line (Fig. 1B). For 89Zr-DFO-CD3, binding averaged 47,700 ± 4,080 cpm, whereas binding for 89Zr-DFO-IgG was only 6,430 ± 495 cpm (P < 0.01) (Fig. 1C). We also observed a significant difference in binding of the 89Zr-CD3 probe between TK-1 cells (47,700 ± 4,070 cpm) and CT26 cells (4,550 ± 445 cpm, P < 0.01), confirming CD3-specific cell binding.
Tumor Analysis
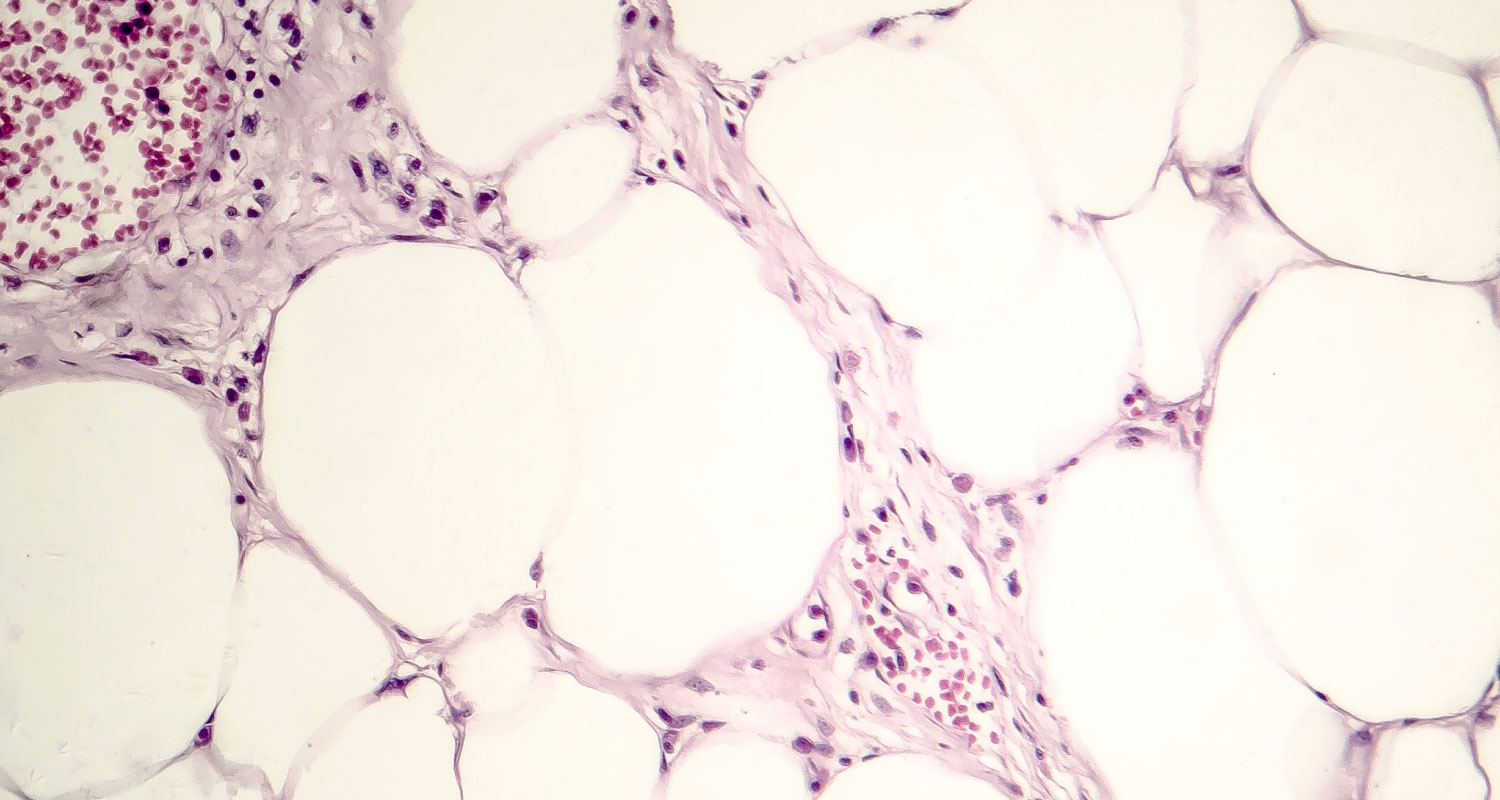
Immunomodulatory therapy resulted in an increase in CD3+ T-cell infiltration. Western blotting revealed distinct tumors with either high or low levels of CD3 (Fig. 2A). This trend remained unchanged when CD8 expression was analyzed as well. Low FoxP3 expression was observed, indicating that CD3 did not correlate with an increased population of regulatory T cells (Fig. 2B). On immunohistochemical staining, high-CD3 tumors had multiple areas of high-density CD3+ infiltrates, whereas most of the low-CD3 tumors had no CD3-expressing cells (Fig. 2C).

FIGURE 2.
Ex vivo quantification and localization of T-cell infiltrate protein. (A) Western blot analysis of treated CT26 tumors shows 1 tumor with low CD3 expression (L) and 2 tumors with high CD3 expression (H1 and H2) and their CD8, FoxP3, and β-actin characteristics. (B) Quantification reveals relatively high concentrations of CD3 and CD8 in H1 and H2 tumors, uniformly low immunosuppressive FoxP3 protein, and similar overall total β-actin protein across all samples. (C) Representative areas of high and low CD3 infiltration show spatial localization on immunohistochemical staining.
PET Response Prediction
Regarding prediction of response to anti-CTLA-4 therapy (10), the tumors were found to be readily visualized and clearly delineated by PET imaging (Figs. 3A and B). Uptake was also seen in the liver, spleen, lymph nodes, and thymus. The liver is a well-known route of clearance for antibodies, and all the other organs that showed uptake are immune-related reservoirs of CD3+ T cells (Fig. 3C). The tumor-to-liver SUVmean ratios revealed 2 distinct groups (Fig. 3D): a high-uptake group (n = 3) with tumor-to-liver ratios of 0.31–0.63 and a mean of 0.48 ± 0.09 and a low-uptake group (n = 4) with tumor-to-liver ratios of 0.13–0.26 and a mean of 0.19 ± 0.04. This difference was statistically significant (P < 0.05).

FIGURE 3.
(A–C) Representative coronal PET images of anti-CTLA-4–treated CT26 tumor–bearing mice with high tumor uptake (A and C) and low tumor uptake (B). Insets show axial slices to further illustrate uptake. Hepatobiliary clearance through liver is seen, as expected. Uptake is also seen in some lymph nodes. (D) Graph of SUVmean tumor-to-liver ratios validates significant difference between low-uptake and high-uptake groups. * = lymph nodes; L = liver; T = tumor; Th = thymus; TNR = treated nonresponders; TR = treated responders. *P < 0.05.
Tumor Growth
On day 14, the average tumor volume was 125 ± 59 mm3 (range, 34–234 mm3) in the high-uptake group and 41 ± 10 mm3 (range, 12–56 mm3) in the low-uptake group (P = 0.35) (Fig. 4A). Vehicle-treated control mice (n = 4) had a mean tumor volume of 167 ± 30 mm3 (range, 100–245 mm3), which was not statistically different from the high-uptake group (P = 0.12). Measurement of the tumors on day 17 demonstrated a reversal of average tumor volumes, with the high-uptake group having a significantly smaller tumor volume (149 ± 31 mm3) than the low-uptake group (433 ± 42 mm3, P < 0.05) or the control group (519 ± 102 mm3, P < 0.05) (Fig. 4B).

FIGURE 4.
(A) Tumor growth curves. Mean (±SEM) tumor volume for 3–4 mice is plotted on each day of measurement. (B) Scatterplot of individual tumor volumes on day 17. Error bars represent SEM. TNR = treated nonresponders; TR = treated responders; VEH = vehicle-treated mice.
DISCUSSION
Immune checkpoint inhibitors have advanced rapidly over the past decade. Three Food and Drug Administration–approved therapeutics—ipilimumab, pembrolizumab, and nivolumab—have drastically improved overall survival in those patients who respond, but the subpopulation of responders is currently undefined (2,12,13). Several candidate biomarkers for response prediction, including PD-1, PD-L1, CD8, and CD3, are being analyzed through multiple methods, including biopsy, genetic screening, and molecular imaging (8,14,15). Although pretherapeutic markers such as PD-L1 have been found partially predictive in specific cancers, less than half the patients who are found to be PD-L1–positive achieve an objective response (16). Additionally, whereas next-generation sequencing has provided clues into the effects of mutational load on response to immune therapy, a definitive clinical mutational load has yet to be defined (17). In contrast, T-cell markers such as CD3 represent a more direct approach to monitoring immune response to cancers by detecting active recruitment of the T cells responsible for cancer cell death. This approach could be especially effective as numerous different therapeutic strategies emerge, eliminating the need for individual biomarkers and instead focusing on T-cell infiltration as a common pathway for early assessment of therapeutic response. Although PET probes targeting PD-1 and CD8 have been investigated as imaging agents, a correlation with immune response or tumor growth before tumor response divergence has not been demonstrated (18,19). Thus, in our study we sought a CD3 imaging agent not only to demonstrate the ability to image tumoral CD3 infiltration but also to correlate with subsequent therapeutic response.
Histologic analysis of CT26 tumors treated with anti-CTLA-4 demonstrated differential CD3+ T-cell infiltration (Fig. 2), which we used as the basis for correlating differences in CD3 with survival. CD3 PET imaging on day 14 revealed 2 distinct groups of mice, one with high uptake and another with low uptake. Importantly, on day 14, the mean tumor volumes were not predictive of response, as the average tumor volume for the high-uptake group was larger than that for the low-uptake group, although the difference was not significant. By day 17, however, a clear difference in response was observed, as the tumors of the high-uptake group remained significantly smaller than those of either the low-uptake group or the control group. Furthermore, tumor size did not significantly differ between the low-uptake group and the control group, and the large tumor volumes in these groups constituted an endpoint for the study. These findings indicate that high-CD3 PET uptake in the anti-CTLA-4 treated mice correlates with immune response and is a predictive biomarker of response.
Although the CD3 PET imaging data suggest a novel paradigm for predicting immune response in tumors treated with checkpoint inhibition, further work is required to validate and translate this paradigm for clinical application. Full-size IgG PET imaging has been successfully used in clinical imaging trials, but future work may benefit from pharmacokinetic optimization using smaller vectors such as peptides, small molecules, or other smaller biologic constructs (e.g., scFvs, minibodies, Affibody molecules, or single-domain VHHs) to optimize the time from injection to imaging and improve specific uptake (19,20). Furthermore, the paradigm should be further evaluated with the myriad of immunotherapies currently under investigation, including vaccines, adoptive cell transfer, and combination therapies in other clinically relevant cancers such as lung and metastatic melanoma.
CONCLUSION
Immunooncology has greatly improved the outlook for patients who are otherwise facing a dim prognosis, although this success has been tempered by the lack of a clear indication as to who will respond to novel therapies. The results presented here demonstrate that PET imaging of CD3+ T-cell infiltration may represent a useful noninvasive imaging paradigm for predicting response to targeted immunotherapy before anatomic changes become apparent.
DISCLOSURE
The costs of publication of this article were defrayed in part by the payment of page charges. Therefore, and solely to indicate this fact, this article is hereby marked “advertisement” in accordance with 18 USC section 1734. Funding was provided by grant P50-CA127003 from the National Institutes of Health. No other potential conflict of interest relevant to this article was reported.
FOOTNOTES
Published online May 26, 2016.
© 2016 by the Society of Nuclear Medicine and Molecular Imaging, Inc.